

By Kirk Whisler
I’ve been wanting to write this article for more than a decade, but I just didn’t have the time in my busy schedule. Finally, I knew I had to do it now, after my wife, Magdalena, retired after 28 years teaching with the Vista Unified School District—and I saw how hurt she was that she was not replaced by a Latino teacher as she desired.
All but one of the schools where she taught have 85+% Latino enrollment but rarely have more than a handful of Latino teachers. Over the last 35 years, several dozen key studies and hundreds of articles have cited numerous reasons why it is very important that, for at least some of their school years, students have a teacher of their same ethnic or cultural background. See the article “11 Reasons Latino Teacher Representation Matters to Latino Student Success.”
As we went from the data gathering phase to the data analysis phase, I became increasingly more depressed. While we certainly found some bright spots, overall, we found that in many categories, most diverse students in North San Diego County are not only behind other comparable diverse students here in California, but in select categories, these students are also behind other comparable students in the rest of the United States.
Using Local, State, and National Educational Diversity Research to Give Us New Insight
For decades, education research for districts has been widely circulated, but it rarely delves into the diversity of students and teachers at the district level. For this research, we looked at a wide variety of data from all of California’s slightly more than 1,000 school districts, numbers from each of California’s 58 counties, some national data, and figures from a few select other states.
Much of our analysis for this article focused on the 14 most-diverse school districts in the North County, where the vast majority of North County Informador’s reach is.
All the data are available HERE.
You will also see data for all the eight diversity groups for which the state collects data, as well as for other groups like English Language Learners, Disabled Students, and Migrants. We hope you find this research useful.
How Is California Doing in Serving Diverse Communities Educationally?
Latino students in Texas are an amazing 69% more likely to have a Latino teacher than Latino students in California, and Black students in Texas are 84% more likely to have a Black teacher than Black students in California. In fact, even though California has 33% more people than Texas, Texas has a total of 114,597 Latino teachers—39,623 more than California!
How did this disparity happen? In the 1970s and 1980s, California led the nation in diversity within the teaching field. When California Governor Pete Wilson led the attacks on undocumented children and diversity overall through efforts like Proposition 187 in 1994 and Proposition 227 in 1996, he gave a green light to many school districts to go back to prioritizing white teachers.
Over the decades since then, a few efforts have helped in recruiting and hiring more Latino and diverse educators, but there were never enough Latino teachers as the number of Latino students in California grew from 951,917 in 1980, to 2.6 million in 2000, to 3.2 million in 2025—a 236% increase, while white students went from 2.4 million in 1980, to 2.2 million in 2000, to 1.1 million in 2025—a decrease of 54%. Overall, diverse students have gone from 40% in 1980 to 80% in 2025.
North San Diego County Student Diversity
Diversity of students in North San Diego County has been increasing for years, especially regarding Latino students. In 2010, diverse students represented 59% of North County students; by 2024, that number was 68%. In 14 North County school districts that serve the vast majority of North County Informador’s readers, Latinos are 49% of the 154,000 total students. In fact, for every white student, there are 2.5 Latino students. In California overall for the 2024–2025 school year, there were 5.8 million K–12 students; 3.3 million were Latino (56%), and 1.2 million were white (20%).
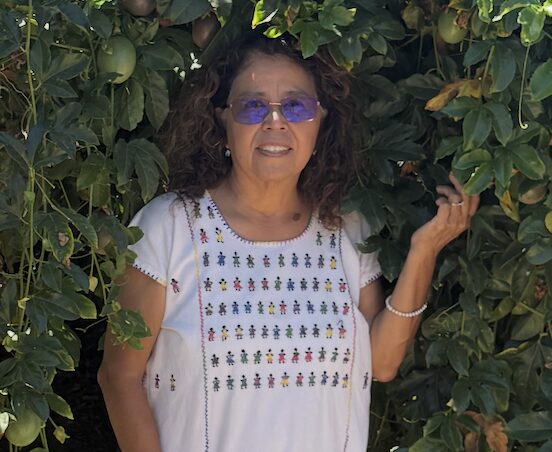
Magdalena Gonzalez Whisler: Changing the Face of Education One Teacher at a Time
Magdalena Gonzalez Whisler retired in 2025, after nearly 30 years with the Vista Unified School District. She spent most of her years teaching first and second grade because she wanted to get those young minds hooked on reading. Almost her entire career she worked at schools with 85+% Latino students.
While Magdalena has never seen herself as a community leader, she has spent most of her life working 50-hour weeks to make sure these students got the opportunities they deserved. The parents always loved the fact that their children had a teacher who could speak to them in Spanish and who understood their culture and had the perfect blend of a firm hand and a soft heart.
Magdalena remembers the times a parent shared, “My son didn’t like to read at all at the beginning of the school year, and now all he wants to do is read.” One of her favorite success stories was about 25 years ago, when one of her students won a statewide writing award and read his essay before an audience of more than 1,000 people.
While she misses all the hugs she got from her former students, rarely a month goes by that a 20 or 30 something doesn’t say, “Mrs. Whisler, don’t you recognize me?”
Upon retirement, Magdalena decided she wanted to go back to college. She is working toward a degree in sustainable horticulture from MiraCosta College so she can grow even more plants at her home in Fallbrook. Each teacher is, of course, unique. We only wish there were a lot more teachers like Magdalena here in North San Diego County.
So, there were 2.8 Latino students for every white student and 4.0 diverse students for every white student. See our Enrolled Students for 2010 & 2024 by District chart for more insight by districts.

The Student–Teacher Diversity Ratio
Districts that are paying attention to diversity trends here in California have hired an additional 13,456 Latino teachers and 1,255 Latino administrators in just the past five years! The Latino Diversity Index Educational Ratios for 2019 & 2024 chart shares the ratios for teachers, administrators, and professionals, as wells as the hiring goal to reach parity in each of these categories. See our Teachers for 2019 & 2024 by District chart for key insight; please take a look at the All the Administrators and Professionals chart.
Perhaps our most important chart is the Latino Diversity Index Educational Ratios chart. Please compare the percentage of students with those for teachers and other professions. For the Student–Teacher Ratio, the goal should be roughly 20. The green column shows how many Latino teachers need to be hired to meet that goal.
A Positive Evolution for Most Districts: Fewer Dropouts
In the last two decades Latino dropout rates statewide have substantially decreased. Both California overall and San Diego County now have an average Latino dropout rate of 8.5%. The figure is not where we want it to be, but it is closer. Look at the Dropouts for 2010, 2018, & 2024 by District to see where your local district falls.

The Seal of Biliteracy: A Major Sign of Achievement
Under the guidance of organizations such as the California Association for Bilingual Education and Californians Together, the Seal of Biliteracy has become a major advantage for many diverse students seeking to go to college and achieve higher-paying professional careers. In California, 70,511 students graduated with the seal in 2025, and 62% of them were Latino. Statewide, 18% of Latino graduates got the Seal of Biliteracy, and 23% got the Golden State Merit Diploma. For the core area of Latinos in the North County, 19% got the Seal and 31% got the Golden State Diploma—but the range of results is quite wide. It is best to look online at our final chart for a wide variety of key data from this and the final two sections.
Graduating UC- or CSU-Qualified
The percentages of graduating students who meet the requirements to be accepted at the University of California (UC) and the California State (CSU) schools have soared for almost every group as the Seal of Biliteracy, Golden State Honors, UC/CSU Qualified, & Going to College by District chart shows. Latinos statewide now average 47%, but here you can see Latinos in many of our local districts do much better than that. Be sure to note how this percentage compares with the percentage of Going to College.
Going to College
For many families, Going to College is the most important piece of data. Of California’s Latino high school graduates from the spring of 2023, the most recent year for which we have data by districts, 60% were enrolled in college a year later, a key improvement from earlier decades. In the core Latino districts of the North County the number ranged from 66% all the way 30%—a huge difference.
What Can Be Done?
- If you are a Latino parent of a K–12 student, do not be afraid to ask for a Latino or Latina teacher for your child if that is your desire. It may not happen, but if enough parents ask for it, it will certainly help the effort. Retired teacher Magdalena Gonzalez Whisler shared, “Latino parents do not know how much power they have. They need not be afraid to demand things from their school district. If you want something in Spanish, be sure to request it. Do not be intimidated by the current political turmoil.”
- Community leaders can use this data to ask questions of their local school districts. While we have seen a tripling of Latino school board members here in North San Diego County in the past decade, we still have a long way to go to reach parity.
- School board members can, if they desire, use this data to work toward hiring a more diverse workforce at all levels. Remember, 13,456 new Latino teachers were hired in the past five years. Why not hire them into their districts?
This article includes a lot of numbers, which may seem overwhelming, but we must all remember that the point is to make sure children are being given an equal opportunity to succeed.
Please see all the charts with the full data at: https://northcountyinformador.com/changing-the-face-of-education-in-north-san-diego-county/